 labsUI
Analytics dashboard
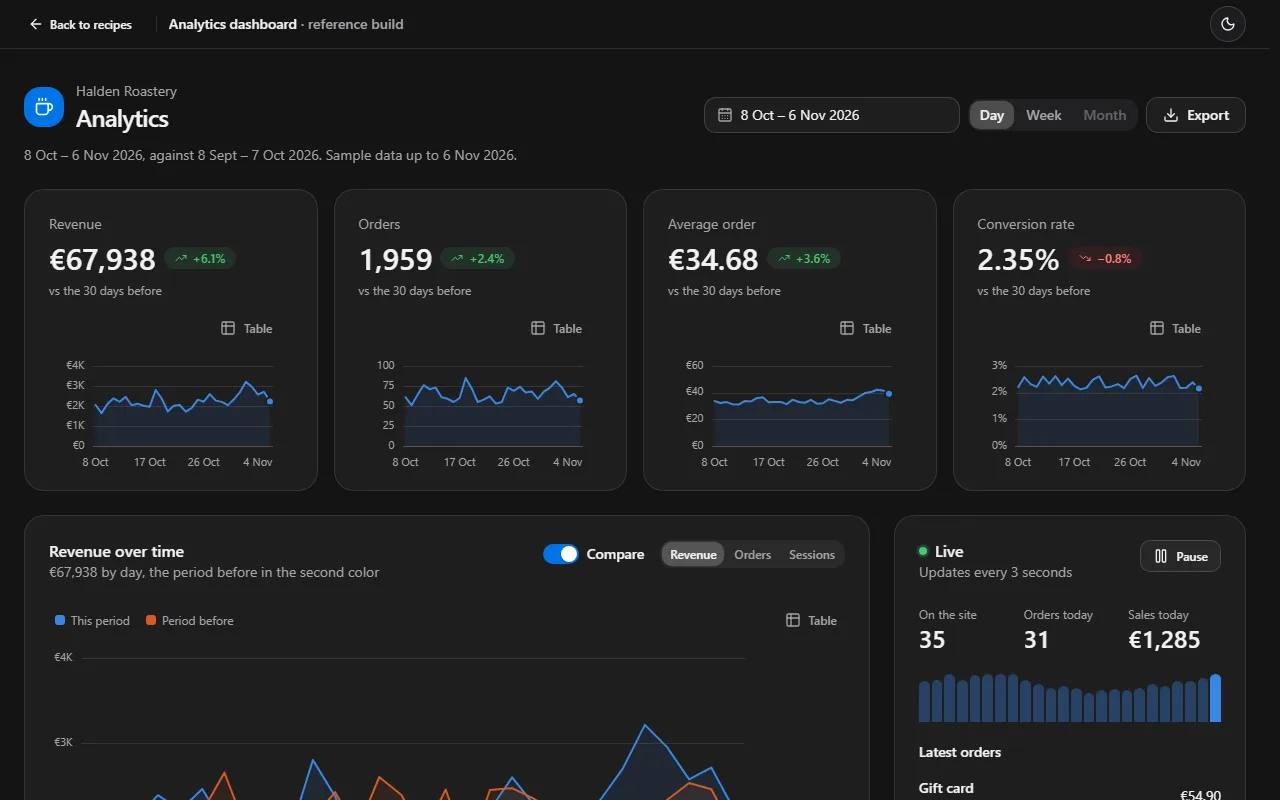
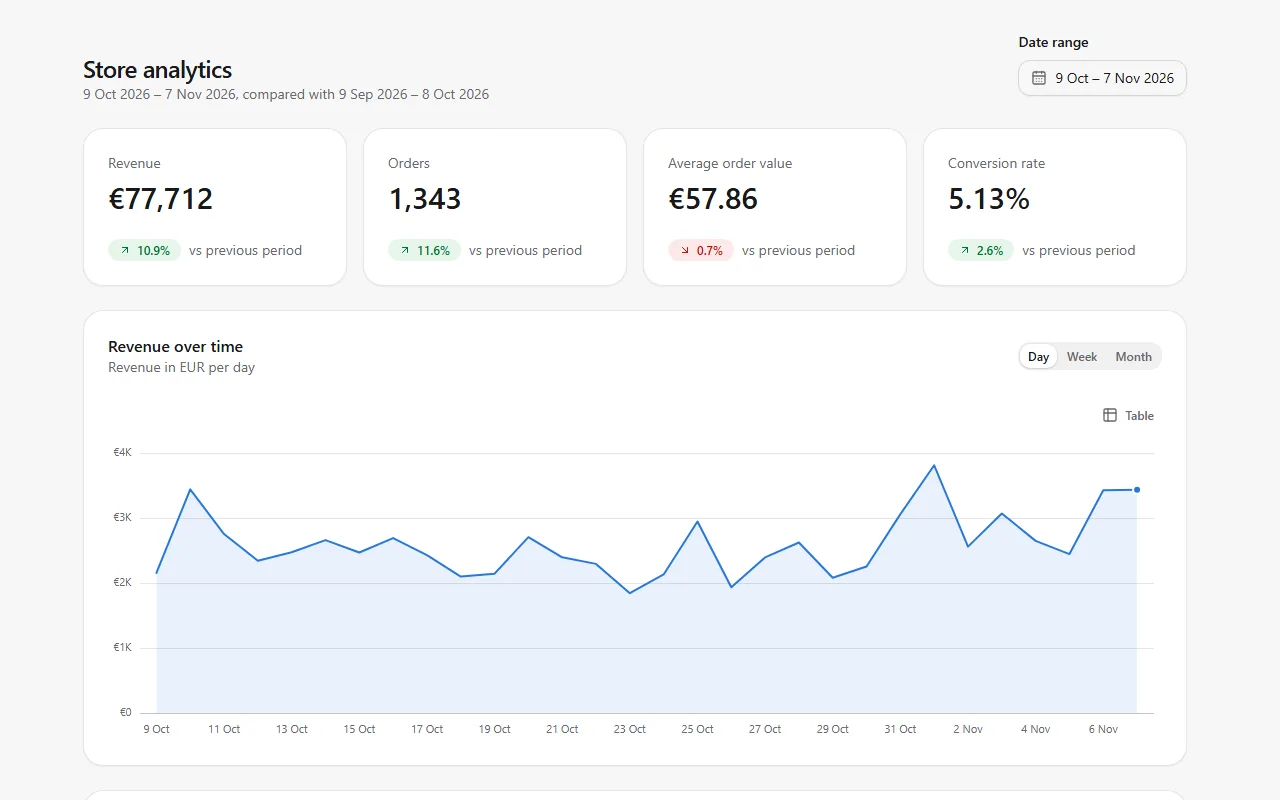
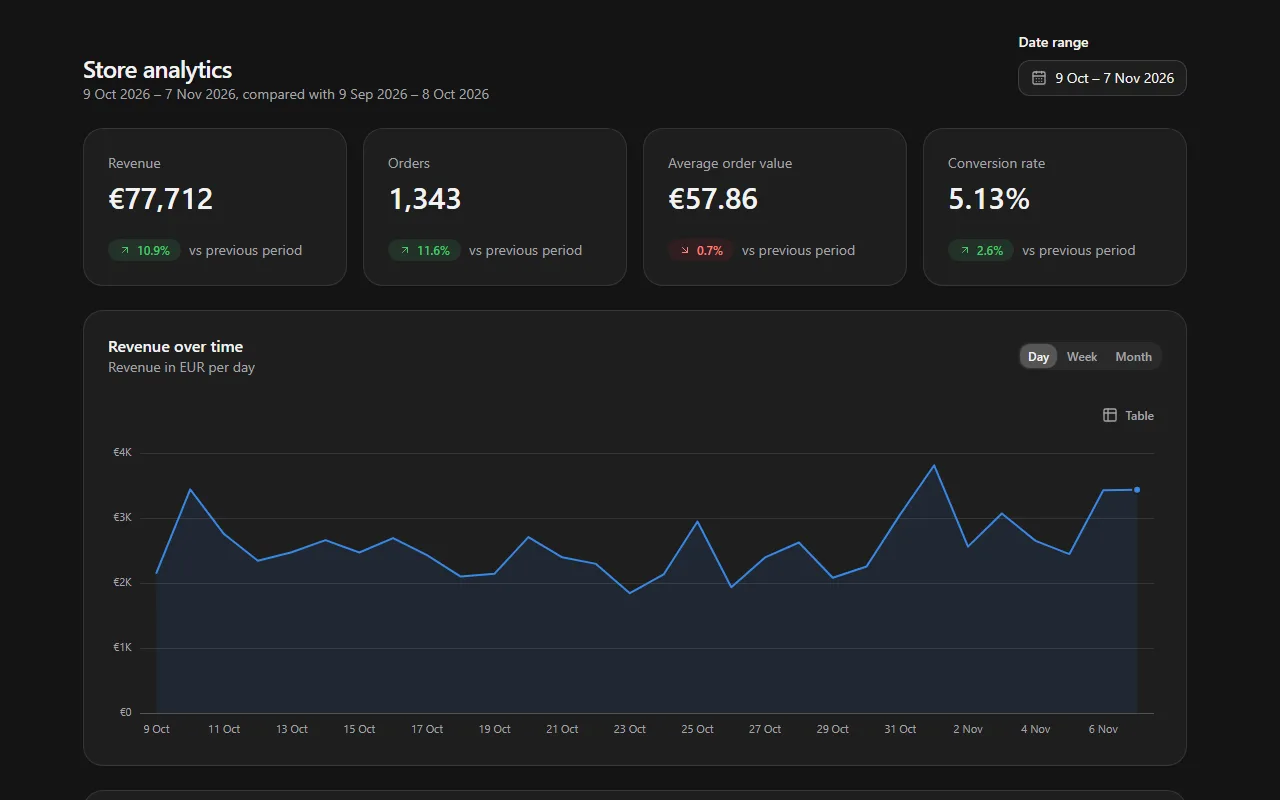
A store dashboard in euros: key figures that count up with their change, revenue over time, a date range with day, week and month, and a table of top products.
Open demo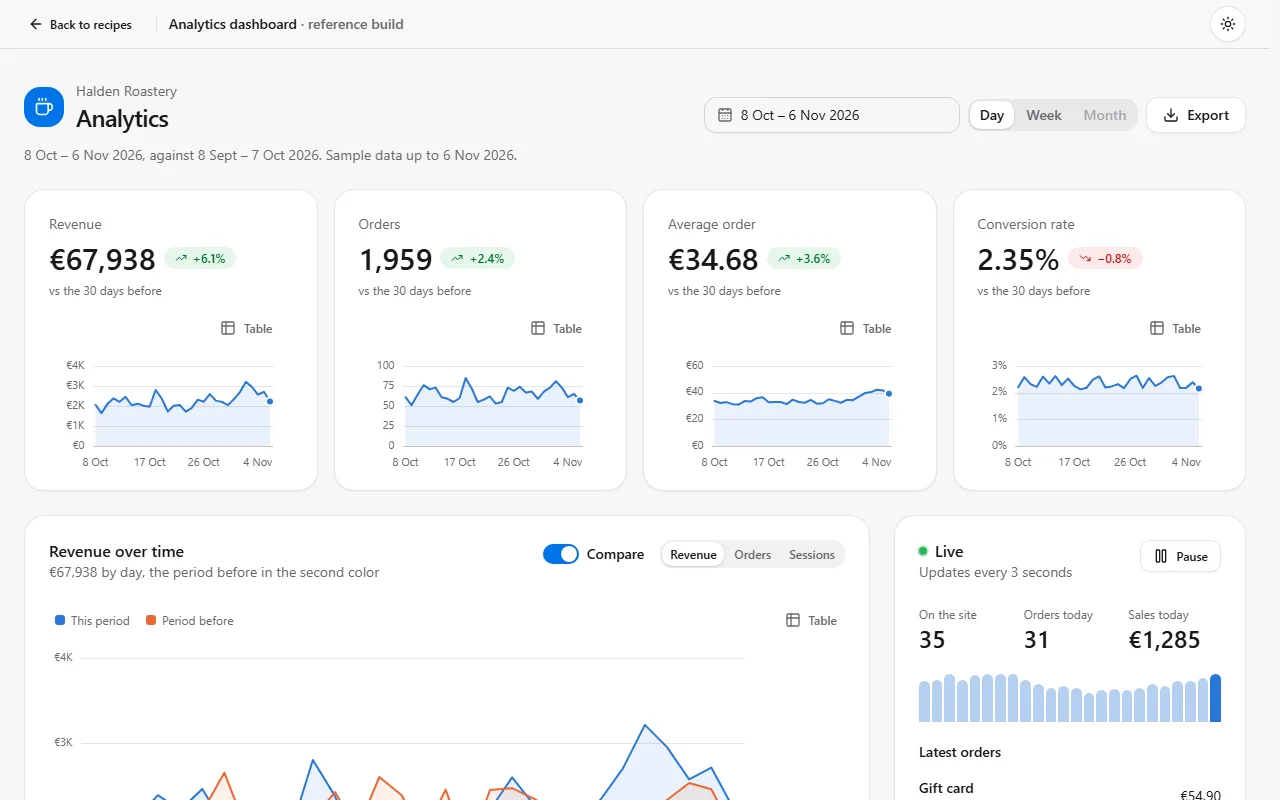
Prompt
Using labsUI, build an analytics dashboard for a small online store, amounts in EUR, all text in English: key figures that count up with their change since the last period, a chart of revenue over time, a date range picker and a switch between day, week and month, and a table of top products. Use sample data.
Checked on labsUI 0.2.1 with Claude Sonnet, November 7, 2026: a fresh Next.js 16 app, the agent using only the labsUI MCP server. Its build passed and axe found no violations from labsUI.
The raw run
The checked run's own result, before any polish: what the prompt alone got.
Components it uses
The agent adds these itself. To start by hand, after npx @kznlabs/labsui init:
What the result needs
A counting figure in a StatTile
StatTile's value takes a node, so a CountTo goes straight in, and the tile adds the change Badge and a trend chart from the same rows as the big chart. To spring from the last number when the range changes, not from zero, keep the shown number and pass it as from.
function Counter({ to }: { to: number }) { const [shown, setShown] = useState({ from: 0, to }); if (shown.to !== to) setShown({ from: shown.to, to }); return <CountTo from={shown.from} to={to} prefix="€" locale="en-IE" />;}<StatTile label="Revenue" value={<Counter to={revenue} />} delta={change(revenue, previousRevenue)} period="vs the 30 days before" data={rows} dataKey="revenue" format={{ style: "currency", currency: "EUR", maximumFractionDigits: 0 }}/>Compare with the period before
Take the same number of days right before the range, and put each bucket's earlier twin on the same row as a second series: Chart's tooltip then lists both, and its legend can hide either. Keep every figure's change on that one rule, so tiles, channels and products agree.
Day, week and month that fit the range
Disable a ToggleGroupItem that doesn't fit (day bars past three months, one month bar), and when a new range rules out the current one, switch to the nearest that fits. DatePicker presets cover the common ranges; min and max keep it to days that have data.
Dates without time zones
DatePicker hands out local midnights. Turn them into a day key with Date.UTC(date.getFullYear(), date.getMonth(), date.getDate()) and format labels with timeZone: "UTC", so a visitor west of the data's zone doesn't see every bucket a day early.
Where real data plugs in
Fetch totals per day for the range and the period before in a Server Component or a route handler, and bucket on the server for long ranges. A live panel that updates by itself needs a pause (WCAG 2.2.2).